
The number of tower cranes in the Sydney skyline has dropped since its peak in 2017, having a major influence on the level of confidence in the NSW economy.
Sydney’s crane construction count has again eased a tad from its 2017 peak. Not too significantly, but it does mean fewer jobs for construction workers, and the flow through into the NSW economy.

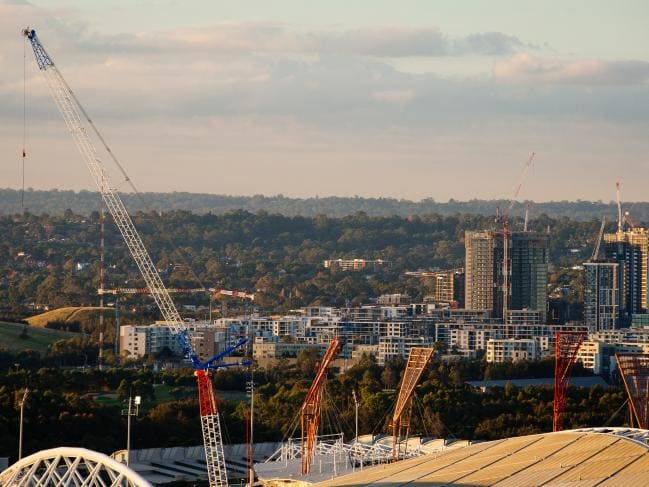
Sydney has 42 per cent of all cranes erected nationally. Picture: Jonathan NgSource:News Corp Australia
There are currently 310 cranes on the Sydney skyline, down from the 350 peak which came with six years of consecutive rises in crane numbers. Of these, some 229 are residential cranes nicely spread across 113 suburbs.
The CBD and surrounding inner suburbs have 106 (34 percent) of the installed cranes, the eastern suburbs have 13 (4 percent), the north has 107 (34 percent), the south has 27 (9 percent), the west has 57 (18 percent).
Every crane in the sky is a sign of confidence in the future of Sydney.
With counting cranes in China a little complex, Sydney still sits second behind the longtime undisputed global leader for tower cranes in the Middle East. On one recent count, Dubai proudly had 1182 cranes, with their build it and they will come philosophy.
Residential cranes in Sydney account for 74 percent of all cranes in Sydney, and 44 percent of residential cranes nationally.
As always, it is a dynamic situation with 127 additions and 141 removals of residential cranes over the past quarter, according to the latest edition of the Rider Levett Bucknall Crane Index, which highlights the vital role of the construction sector within Australia’s economy.
There were cranes removed from Castle Hill, Dee Why and Chatswood as apartment projects reached completion.
Seven cranes were removed from residential projects in the south, driving the overall dip in crane numbers. Sydney’s west saw the most significant decline in overall cranes from 78 to 57, with 42 now being residential.
Some 49 cranes were removed in the west and 28 added including Ed Square’s four cranes and three at the Lennox in Parramatta.
More came to Darling Harbour.
There are some interesting national cyclical trends emerging across the capital cities.
Currently, Sydney has 42 percent of all cranes erected nationally, while Melbourne contributed 30 percent and Brisbane 8 percent. Sydney’s dominance has fallen slightly from a high of 52 percent in 2017.
Melbourne’s crane numbers surged past the 200 mark for the first time.
In the first quarter of 2019, there were 735 cranes counted across Australia, with 530 for residential projects and 205 non-residential developments, including the non-residential sector of offices, transportation, hotels, education, health, and retail.
Our construction spurt has helped NSW maintained the lowest unemployment rate in the nation at 3.9 percent.
But one indicative economic indicator suggests property industry jobs are slowing. According to the jobs website Seek.com.au construction industry job advertisements are 14 percent lower than this time last year, while real estate jobs are down 15 percent and design and architecture jobs down 20 percent.
All those construction workers in high visibility vests — buying their pies at lunchtime, spending up on tools, filling up their utes with fuel and buying their own first homes — are underpinning NSW’s economic progress.
By Jonathan Chancellor
Originally published as Crane count has impact on NSW economy


